ERP with Data Analytics for Machine Trending
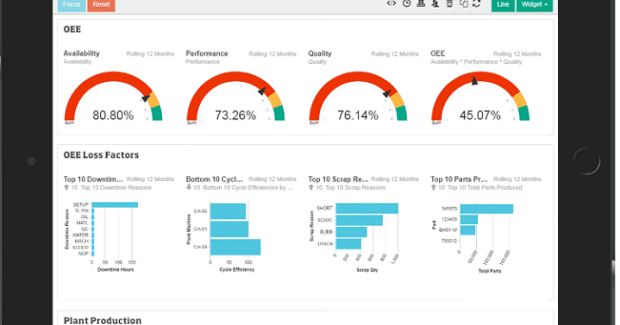
The OEE KPIs Dashboard for EDA Mattec Content shows how the combination of ERP and MES content in the same EDA solution from Epicor gives shops a complete, affordable, and easy-to-use system.
Posted: September 25, 2018


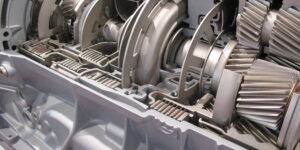
In Booth A-2942, Epicor Software Corporation (Austin, TX) added Epicor® Data Analytics (EDA) content for their Mattec® Manufacturing Execution System (MES™). The massive amount of machine and operator data collected by Mattec MES is uploaded to EDA in the cloud so that manufacturers can see the long-term and short-term term trending of overall equipment effectiveness (OEE) and then drill down into the analysis grid to quickly find any causes having an adverse effect on the numbers. Mattec MES can communicate with equipment through a number of ways, including Open Platform Communications (OPC)-compliant PLC or via a proprietary Internet of Things (IoT) device which can be used to connect to any machine, even old non-PLC (programmable logic controller) equipment or auxiliary systems.
EDA, powered by Phocas™, is a complete solution for manufacturers who run Epicor ERP and/or Mattec MES. This all-inclusive BI comes with content packs out-of-the-box that look at financials, sales, production, and materials. It’s a cloud-based subscription that is affordable and users don’t have to worry about keeping the server and application running. The power of EDA is in the simplicity of its approach. The charts and indicators in the OEE KPIs Dashboard are simple and non-intimidating, and users can learn the basics in less than 30 minutes: Look at the pie chart, gas gage, bar chart, etc. to see if something visually stands out, then drill down into the underlying analysis grid and find out why with a variety of quick focusing features. Shops can quickly realize the full power of the analysis grid and user adoption can quickly spread across the enterprise.
Epicor Software Corporation, 804 Las Cimas Parkway, Austin, TX 78746, 800-999-1809, www.epicor.com.
Subscribe to learn the latest in manufacturing.

Industry News