Seamless Workflow from CT Scan to Full Statistical Analysis
Volume Graphics integrates Q-DAS’ qs-STAT statistics software with computed tomography (CT) scan data analysis to provide the basis for a deep assessment and continuous improvement of industrial production processes.
Posted: March 12, 2021


Volume Graphics (Charlotte, NC) is extending data export from its non-destructive testing and analysis software based on industrial computed tomography (CT) to Q-DAS’ qs-STAT statistics software. This close cooperation between the two companies, both Hexagon divisions, takes automation to the next level by fully integrating statistical evaluations into a CT scan data analysis workflow.
Many users want to statistically analyze the quality data of their scanned components. This is often a basic requirement for automated applications. Q-DAS solutions, such as the Q-DAS qs-STAT package, are considered to be the de facto standard for statistical analysis. Volume Graphics had already implemented an option for data export to the Q-DAS software in Release 3.3 of VGSTUDIO MAX. The companies are making the data exchange between computed tomography (CT) and statistics even tighter.
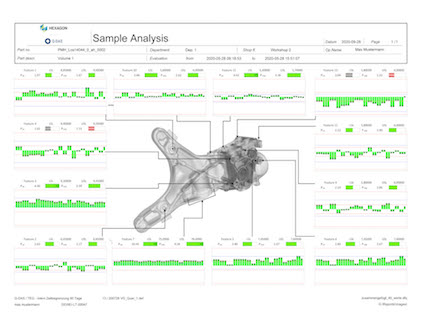
A first result of this collaboration is the option to also export 3D representations of components or measured features to Q-DAS software. This option was introduced with version 3.4.3 of VGSTUDIO MAX, VGMETROLOGY and VGinLINE. The user marks the relevant box in the export mask, and the software adds the corresponding part image to the data to be exported. Users can make their reports, which they define and access with qs-STAT, even more transparent. They can immediately see which measurement series belongs to which detail.
Volume Graphics is also working on including additional results from the array of gray-value-based material analyses, such as defect analyses, in the export functions. The aim is to realize a seamless, fully automated workflow for all CT quality data.
Subscribe to learn the latest in manufacturing.
Industry News